Sunday, February 4, 2018
The Monorail Project - Phasing
Saturday, January 6, 2018
2017 At The Movies
I post to this blog relatively infrequently. This is mostly because the posts here tend to be about creative work that I do in my very limited spare time, and lately I haven't had enough time to make enough progress to be worth posting about. So, as an experiment, I am posting my thoughts about the movies I saw last year. If people find this sort of thing interesting, I may decide to post about my other interests as a way to fill in the very long gaps between major project updates. In other words, I am considering adding more filler!
In many popular discussions about the movie industry in 2017, there was a theme about how people are not going to the movies any more. Certainly, this summer was one of the least attended in recent memory. And movies continue to be a much smaller industry than video games. A lot of the discussion about the poor summer box office seemed to focus on the role of TV streaming services and other changes in the way people like to see movies.
This is probably true to some extent, but I think a far more important factor is that there was a huge hole in the big studios release schedules. I like to go to the movies a lot, and for a period between mid-July and November, there was no new movies released that looked particularly appealing.
Disney, the box office leader for 2017, released zero movies between Cars 3 (June) and Thor (November). The number two studio Warner Brothers, released a few genre pictures in that same time frame and did quite well with 'It', but mostly had an unimpressive slate. The US Domestic Box Office was down by the equivalent of only two or three moderately successful movies. And the overcrowded holiday period probably is hurting some of the current releases that may have done better earlier in the year when there was less competition.
In particular, I feel like this year was lacking in medium-scale comedy films. The only pure comedy movie I saw this year was Fist Fight, which left theaters before I got a chance to see it. But usually I see more than one of this type of movie. And it just felt like there weren't any made that stuck around.
Below is a list of movies I saw in 2017, listed approximately by how much I liked them and scored on a scale of zero to four stars (although I apparently don't see zero star movies).
**** Wonder Woman
**** Baby Driver
***1/2 Thor: Ragnarok
***1/2 Star Wars The Last Jedi
***1/2 Shin Godzilla
***1/2 Logan Lucky
*** War for the Planet of the Apes
*** The Boss Baby
*** Murder on the Orient Express
*** Guardians of the Galaxy Volume 2
*** American Made
*** Despicable Me 3
*** Beauty and the Beast (2017)
*** Dunkirk
*** The Mummy (2017)
*** Fist Fight
**1/2 Star Trek Beyond
**1/2 The Lego Batman Movie
**1/2 Logan
** Pirates of the Caribbean: Dead Men Tell No Tales
** X-men Apocalypse
*1/2 Kong: Skull Island
* Hot Pursuit
You may notice a few movies from 2016 or 2015 on this list. I saw them in 2017, so sue me.
Also, note that there are a small handful of movies that I wanted to see but so far have eluded me. I have not yet had the opportunity to see the following:
Coco
The Disaster Artist
The House
Goon: Last of the Enforcers
The Little Hours
The Post
I decided on my movie ratings on the day I saw the movie. As I compiled the list, I allowed myself to adjust the ratings based on how well the movie aged in my head. For instance, Shin Godzilla went from a *** movie to a ***1/2 movie, because the more I thought about it, the more I appreciated the movie and liked how it was partially about the difficulty of making coordinated decisions about group actions. Likewise, Baby Driver and The Boss Baby got better the more I thought about them.
Not all movies got better with time. War for the Planet of the Apes, Kong Skull Island, and Guardians of the Galaxy Volume 2 went down in the ratings the more I thought of them. Of course, movies that I saw very recently like Star Wars The Last Jedi and Dunkirk may not stick in my mind either. So I guess I am less confident about my thoughts about them.
So, am I a monster for liking Fist Fight better than Logan? Did I miss any other movies that I didn't list here that I should see? And why didn't you go see Logan Lucky?
Sunday, August 27, 2017
The Monorail Project–Build Out Monorail Ridership Daily Trip Distribution
I have calculated the estimated demand for every hour of each segment of my preferred alternative monorail networks. However, to understand what they mean, it is important to understand how many people an hour a monorail can realistically carry.
The design capacity of any grade-separated transit line is determined by several factors:
- total passengers per car
- number of cars per train
- headway (the time between train departures), which is the sum of:
- minimum train separation in seconds
- dwell time at station
Likewise, the Contemporary Resort also forms the overall maximum length of trains. Currently, the monorail station is the northern half of the building. But it is conceivable that the monorail station platform could be extended to run the length of the building (approximately 430 feet). If the monorail cars remain the same dimensions as they are currently, this creates a maximum train length of 13 cars.
Unfortunately, determining the headway of the monorail requires more than some simple extrapolations of the current monorail system.
From the beginning, I have been assuming that the monorail trains and stations would need to be reconfigured to allow for platform-level boarding. Platform level boarding is when the station platform is level with the floor of the train so passengers in wheelchairs can board without the use of a ramp. This eliminates the requirement for a cast member to be present at all stations to operate the ramp, and can dramatically reduce the required station dwell time.
I also assume that all the bugs in the automatic train control can be worked out to allow for the most efficient train spacing.
Because both of these characteristics are not present in the existing monorail system, I have to look to other transit systems to identify a realistic headway time.
Some metro systems have been known to operate with headways of as little as 70 seconds, but that is on metro systems that primarily serve commuters, people most likely to know where they are going and how things work. Perhaps a better comparison might be airport people movers such as the ones at the Orlando International Airport. An airport people mover's load and unload characteristics are similar to the monorail because they have platform level boarding, automated train control, and platform doors. Airport people movers are not as familiar to riders as urban metro systems, because they are not a part of the daily commute for most passengers. Additionally, the riders of such systems frequently have rolling suitcases which may take up space during passenger flows through doorways in a fashion similar to strollers upon exit and entry of the monorail at Walt Disney World.
An airport people mover system can have headways as fast as 90 seconds, but according to the Transportation Research Board's Transit Capacity and Quality of Service Manual, a more typical headway for such a system is 120 seconds.
Once the design capacity was determined using the numbers above, I calculated the achievable capacity. This is the capacity that a transit line can be reasonably assumed to achieve given the variability in demand across an operating hour. The Transit Capacity and Quality of Service Manual recommends a peak hour factor of 0.8 to be used. This means that if the design capacity for a specific segment is 1,000 people in an hour, it should be assumed that only 800 people in an hour will actually be carried before unacceptable train loads or queuing would be experienced.
Monorail Achievable Capacity for Two Minute Headway Operation by Train Length
Cars Per Train
|
6 (Existing)
|
7
|
8
|
9
|
10
|
11
|
12
|
13
|
Train Capacity
|
360
|
420
|
480
|
540
|
600
|
660
|
720
|
780
|
Achievable Train Capacity (Peak Hour Factor of 0.8)
|
288
|
336
|
384
|
432
|
480
|
528
|
576
|
624
|
Design Capacity (people per hour)
|
10,800
|
12,600
|
14,400
|
16,200
|
18,000
|
19,800
|
21,600
|
23,400
|
Achievable Capacity (people per hour)
|
8,640
|
10,080
|
11,520
|
12,960
|
14,400
|
15,840
|
17,280
|
18,720
|
Now that these capacities have been determined, we can look at the estimated hourly capacities of each network to determine what each network would look like (and whether it would even work at all).
When I first calculated these numbers, I wanted to create some GIFs that would show the estimated ridership on each segment for each hour of the day. Unfortunately, after spending my free time on this task for the last several months (I determined the ridership numbers in February 2017), I have come to the conclusion that either Data Driven Graphics in Photoshop defy logic or (more likely) that I bit off more than I could chew. So, I will instead present some charts showing the maximum hourly demand for each line and maps showing the peak hour passenger flows for each network. If anyone out there knows anything about Data Driven Graphics in Photoshop and wants to help, feel free to comment on this post. Because I still think it would be a helpful way to visualize the passenger flows on each network.
Network 1094 Characteristics
Line
|
Max. Hourly Passengers
|
Peak Hour
|
Peak Segment
|
Cars Per Train
|
Headway (minutes)
|
Cycle Time (minutes)
|
Trains Required
|
Park Connector B
|
22,139
|
10:00AM – 11:00AM
|
Hollywood Studios - Epcot
|
13
|
1.7
|
34.7
|
21
|
Existing Resort
|
2,163
|
10:00AM – 11:00AM
|
Grand Floridian - Magic Kingdom
|
13
|
8.0
|
15.9
|
2
|
Epcot Loop B
|
3,378
|
10:00AM – 11:00AM
|
Port Orleans French Quarter - Epcot
|
13
|
9.9
|
9.9
|
1
|
Epcot Loop E
|
8,193
|
10:00AM – 11:00AM
|
Saratoga Springs - Disney Springs West Side
|
13
|
4.0
|
31.9
|
8
|
Studios Loop A
|
4,559
|
10:00AM – 11:00AM
|
Boardwalk - Hollywood Studios
|
13
|
5.3
|
15.9
|
3
|
Animal Kingdom Loop A
|
6,392
|
10:00AM – 11:00AM
|
All Star - Animal Kingdom
|
13
|
4.7
|
14.1
|
3
|
The monorail network with the highest score per mile, Network 1094, has one link with a passenger demand greater than the maximum achievable capacity of a monorail at Disney World given my original constraints. This link, connecting Hollywood Studios to Epcot, would require the longest trains possible to operate at headways of only 1.7 minutes. Unfortunately, this would not be possible to achieve on a consistent basis, so this network must be rejected.
Before we completely reject this network, I do want to discuss a possible confounding factor that may make this a more feasible option. When I started working on this project four years ago, there wasn’t even the slightest hint that the Skyliner gondola transit system would be built connecting Hollywood Studios to Epcot. It remains to be seen exactly how this system will operate and how it would be integrated with any monorail network expansion. But this gondola transit system is being built in the area where my network model suggests there would be the greatest demand. So potentially a network like this may still have a chance of being technically possible.
Network 838 Characteristics
Line
|
Max. Hourly
Passengers
|
Peak Hour
|
Peak Segment
|
Cars Per Train
|
Headway
(minutes)
|
Cycle Time
(minutes)
|
Trains
Required
|
Park Connector B
|
16,775
|
10:00AM – 11:00AM
|
Hollywood Studios - Epcot
|
13
|
2.2
|
34.7
|
16
|
Existing Resort
|
1.391
|
10:00AM – 11:00AM
|
Grand Floridian - Magic Kingdom
|
13
|
15.9
|
15.9
|
1
|
Epcot Loop B
|
2,580
|
10:00AM – 11:00AM
|
Old Key West - Epcot
|
13
|
7.8
|
15.5
|
2
|
Studios Loop A
|
2,701
|
10:00AM – 11:00AM
|
Yacht & Beach Club – International Gateway
|
13
|
8.0
|
15.9
|
2
|
Animal Kingdom Loop A
|
3,912
|
10:00AM – 11:00AM
|
All Star – Animal Kingdom
|
13
|
7.0
|
14.1
|
2
|
This network would call for 13 car trains that would arrive on 2.2 minute headways for the Park Connector B line. To provide operational flexibility, I assume that the 13 car trains would be used on the other lines, even though they could achieve an acceptable capacity with shorter trains. The table above indicates that the Epcot Loop C, Studios Loop A, and Animal Kingdom Loop A lines could have headways of approximately 7 or 8 minutes, so riders would have an average wait time of 3 or 4 minutes, comparable to the Existing Resort line and much better than the average headways on many major city’s rapid transit lines.
The Existing Resort line, however, would be able to operate with a single train and would have a headway of almost 16 minutes. I would consider this unacceptable, and although enough capacity could be provided with a single train, I think two trains would be necessary to maintain service quality and keep wait times within the limits described at the onset of this project.
Network 1112 Characteristics
Line
|
Max. Hourly Passengers
|
Peak Hour
|
Peak Segment
|
Cars Per Train
|
Headway (minutes)
|
Cycle Time (minutes)
|
Trains Required
|
Park Connector B
|
34,520
|
11:00AM - 12:00PM
|
Hollywood Studios - Epcot
|
13
|
1.1
|
34.7
|
33
|
Existing Resort
|
3,619
|
11:00AM – 12:00PM
|
Grand Floridian - Magic Kingdom
|
13
|
8.0
|
15.9
|
2
|
Epcot Loop B
|
5,080
|
11:00AM - 12:00PM
|
Port Orleans French Quarter - Epcot
|
13
|
4.9
|
9.9
|
2
|
Epcot Loop E
|
14,905
|
3:00PM - 4:00PM
|
Disney Springs West Side - Typhoon Lagoon
|
13
|
2.5
|
31.9
|
13
|
Studios Loop A
|
6,840
|
11:00AM – 12:00PM
|
Boardwalk – Hollywood Studios
|
13
|
3.8
|
11.3
|
3
|
Sports Loop A
|
11,597
|
11:00AM - 12:00PM
|
Art of Animation - Hollywood Studios
|
13
|
2.6
|
12.8
|
5
|
Animal Kingdom Loop A
|
9,611
|
11:00AM - 12:00PM
|
All Star – Animal Kingdom
|
13
|
3.5
|
14.1
|
4
|
Network 1112 was investigated because it was the highest ranked alternative to have a station at the ESPN Wide World of Sports. This network would carry a whopping 329,000 riders per day and would be the 6th busiest rapid transit system in the United States (behind San Francisco’s BART system which moves 35% more people on 140% more track (source)). However, this network would most definitely not work. At the peak hour in the morning with 13 car trains, the Park Connector B would need to operate at a headway of only 1.1 minute. My research suggests that some rapid transit systems in Eastern Europe may be able to operate at nearly that frequency, but the train doors open before the trains come to a complete stop, the riders are generally commuters who know where they are going and don’t have strollers, the weather is colder so people get out of their seats faster, and the liability and insurance requirements work very differently there than in the United States. In short, this network could not work. Not even the Skyliner gondola system can save it.
To make this system work, I would need to connect the Animal Kingdom side of the Park Connector B to Magic Kingdom and make two separate Park Connector lines running in loops in opposite directions. Maybe one day I will sketch out what that could look like. But for now, pretend this network doesn’t exist and we can move on to discuss something that could work.
Network 453 Characteristics
Line
|
Max. Hourly Passengers
|
Peak Hour
|
Peak Segment
|
Cars Per Train
|
Headway (minutes)
|
Cycle Time (minutes)
|
Trains Required
|
Park Connector A
|
10,382
|
10:00AM - 11:00AM
|
Epcot – Hollywood Studios
|
8
|
2.1
|
40.6
|
19
|
Existing Resort
|
2,163
|
10:00AM - 11:00AM
|
Grand Floridian - Magic Kingdom
|
8
|
8.0
|
15.9
|
2
|
Epcot Loop B
|
3,378
|
10:00AM - 11:00AM
|
Port Orleans French Quarter - Epcot
|
8
|
4.9
|
9.9
|
2
|
Epcot Loop E
|
5,626
|
10:00AM - 11:00AM
|
Saratoga Springs - Disney Springs West Side
|
8
|
4.0
|
31.9
|
8
|
Studios Loop A
|
4,559
|
10:00AM - 11:00AM
|
Boardwalk – Hollywood Studios
|
8
|
4.0
|
15.9
|
4
|
Network 453 was selected because at 23rd, it was the highest ranked alternative to use Park Connector A. This network would be able to operate eight car trains with a 2.1 minute headway on the Park Connector A line and headways of between four and five minutes on all of the resort loops except for the existing Resort Line. The existing Resort Line would be able to operate with only two trains, but the headway would be eight minutes, and would probably be noticeably longer than the waits on the other lines. So, because I can make up whatever I want to, I would recommend having three trains operating on the existing Resort Line so the headways would be in the neighborhood of five minutes like the other resort loops.
This network would carry 178,000 people per day and would be the 9th busiest rapid transit system in the United States (source). The eight-car trains in this network would dramatically reduce the amount that the existing stations would need to be modified, and in most cases would not even require a replacement of any existing track in station areas.
This transit system would require an additional 22 miles of track to build, 36 new eight car trains, 17 new stations and major reconstruction of all the existing stations. This system or any other system expansion described in these posts would optimistically cost hundreds of millions of dollars, and at the end of the day would only increase Disney’s bottom line by the amount that a premium could be charged to the hotel rooms that would be gaining monorail service access. As a fan of the Walt Disney World Monorails and theme parks in general, I am not sure whether I would want Disney to spend that kind of money on something like this instead of, say, a major expansion of an existing theme park.
The construction of such a system would cause major disruption to the existing monorail lines. And once it is built, a minor mechanical problem on a single train would cause incredible disruption resort-wide.
On the other hand, it would be separate guests traveling between parks and hotels from the growing surface traffic congestion across the resort. Wider roads and new bridges aren’t cheap either. Potentially, a monorail expansion could be taken on by the Reedy Creek Improvement District to take advantage of its ability to utilize tax free municipal bonds like what was done with the Disney Springs parking garages.
I am working with a friend who has done some cost estimation for large scale transportation projects so we can try to put together an order of magnitude cost estimate for one of these networks.
If you have any feedback or questions about my methodologies here, please feel free to comment on this post.
About the author: Ben Lytle is an AICP Certified Urban Planner living in Orlando, Florida. He is currently working at AECOM on the architectural facility design of a major theme park attraction in Central Florida and previously worked on the preliminary ground transportation infrastructure design for a theme park resort in Asia. The views expressed in this blog do not represent those of his employer, his employer’s clients, Walt Disney World, or potentially even his own. The information contained in this post is purely speculative and is derived from publicly available information as described elsewhere in this blog. The author does not make any claims to the accuracy of any information presented here. It has not been verified by anybody, and should not be taken any more seriously than any other Armchair Imagineering you read online. So there.
Saturday, January 2, 2016
The Monorail Project - Existing Monorail Ridership Daily Trip Distribution
Saturday, July 4, 2015
The Monorail Project - Network Concepts
Below are the top 25 network combinations and the existing monorail network for comparison.
System number is an arbitrary number used to identify the alternative. System Combination lists the components of the network alternative, with '0' indicating no addition for a particular loop category. I allowed for multiple Epcot alternatives to be selected in a given network combination as long as no resort is served by two stations ('Epcot Loop CE' indicates that the system includes both Epcot Loop C and Epcot Loop E). Rank is the ranking of each combination by Score/Mile.
You may notice that the existing monorail network has the 75th highest Score/Mile. This does not necessarily mean that the Walt Disney World Monorail System should be extended. It is possible that the operational characteristics of any of the 74 higher-scoring systems would be worse than the existing system. And it is quite likely that the substantial capital costs of a greatly expanded system might not pay for themselves. But I was still surprised that any combination would have a higher station score than the existing system.
I selected the 1st, 7th, 10th, 23th-ranked alternatives for further analysis:
Build-Out 1094 was selected because it was the highest-ranked alternative. The ridership characteristics of this network should be nearly identical to the 11th ranked Build-Out 1098, which has all the same stations but uses the longer Hollywood Studios Loop B which does not cross the Hollywood Studios theme park.
Build-Out 838 was selected because it was the shortest network in the top 25 at 33 miles.
Build-Out 1112 was selected because it was the highest ranked alternative with a Sports Loop.
Build-Out 453 was selected because it was the highest-ranked alternative using Park Connector A.
I will be moving forward with the above concepts to determine the likely feasibility and operational characteristics of each monorail network alternative. Between now and the next post on this project, I will need to find a realistic number of guests per room at these hotels (at a peak season) so I can determine the daily ridership on each segment. I will also need to determine the average distribution of trips to theme parks throughout the day so I can begin to model the peak hour operating characteristics of the system. If you have any idea where I can find this data, please let me know.
Saturday, June 20, 2015
The Monorail Project - Resort Loops and Comparisons II
Animal Kingdom Transfer Station
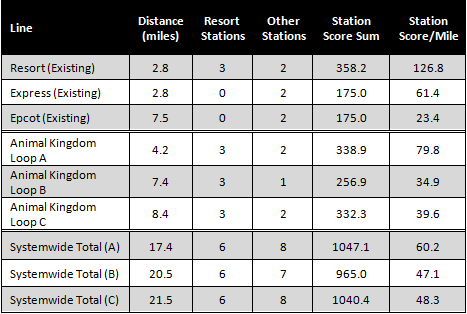
The Animal Kingdom Loop A has stops at both Animal Kingdom Lodge sections, the All Star Resorts, and Blizzard Beach. This means that it can only be considered along with the Park Connector B option without having a transfer at Blizzard Beach.
A transfer station at Blizzard Beach is not recommended because this water park currently has free parking. Even if parking at Blizzard Beach cost the same as the other theme parks, I could imagine this being inadvisable, because it may be considered more convenient to park close at the water park and ride the monorail to Hollywood Studios or Animal Kingdom. Come to think of it, this could also be considered an argument against the regular stop at Blizzard Beach on Park Connector A in general.
Animal Kingdom Loop B drops the Blizzard Beach station, which naturally implies that it would pair better with Park Connector A.
Animal Kingdom Loop C drops the stop at the All Star resorts and goes to Coronado Springs instead.
Generally, all three Animal Kingdom loops strike me as being somewhat poor choices for construction because of the long length of the lines and the way the resorts are laid out straddling the swamps of Reedy Creek.
Epcot Transfer Station
Like the resorts near Animal Kingdom, the resorts near Epcot are spread across both sides of a swampy body of water (the Sassagoula River). But the Epcot resorts are even more difficult to connect by monorail because the center of this section of the resort is home to the Lake Buena Vista Golf Course. For obvious reasons, any proposed monorail extension would need to avoid crossing a golf course or the impacted parts of the golf course would need to be reconstructed to avoid the alignment.
As a result, the Epcot Loop A gets a strange amoeba shape and is an unwieldy long route.
Epcot Loop B dispenses entirely with the idea that the monorail needs to serve the Downtown Disney area. However, it would be rather strange if the only hotels with direct access to the front entrance of Epcot had some of the least futuristic themes of all the Disney World resorts.
Epcot Loop C adds a stop at Old Key West by following the resort entrance road to the water taxi dock.
Epcot Loop D ignores the Port Orleans area entirely and just serves the Downtown Disney/Typhoon Lagoon area.
I was unhappy with how long Epcot Loop D was considering that it only stopped at one resort. So I decided to add stops for the resorts at Hotel Plaza Blvd. The Hotel Plaza Blvd South station is located near the Wyndham, Holiday Inn, and the Hilton resorts. The Hotel Plaza Blvd North station is near the Best Western, Doubletree, and the B resorts. Finally, I added a station at the Buena Vista Palace resort. Although these resorts are not owned by Disney, they are located on land owned by Disney. Therefore, the feasibility of these stations is similar to that of the station at the Swan and Dolphin.
For Epcot Loop E, I also added stations at Downtown Disney West Side and the Downtown Disney Marketplace. The station labeled Downtown Disney may or may not be included in a final version of this alternative. Regardless of how many stations are located at Downtown Disney, I only gave this alternative the station score points as if it stopped at Downtown Disney just once.
Somewhat surprisingly, the Station Score per Mile of the Epcot monorail loops are fairly consistent. In a complete build out, it is possible that Alternatives B or C could be built in addition to Alternatives D or E.
Next time I will discuss the possible combinations of routes I can combine to develop a complete system. The system-wide Station Score per Mile will help me identify the top ideal build outs of a Disney World monorail system. If there are any possible monorail networks that have a higher score than the existing monorail, it will be kind of cool.